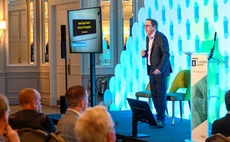
'We're so good at detecting patterns that we detect patterns that aren't there,' says Wael Elrifai
CIOs shouldn't be fooled by visualisation tools that claim that they can enable enterprises to explore datasets, according to Wael Elrifai, director for enterprise solutions EMEA at Pentaho. Spe...
To continue reading this article...
Join Computing
- Unlimited access to real-time news, analysis and opinion from the technology industry
- Receive important and breaking news in our daily newsletter
- Be the first to hear about our events and awards programmes
- Join live member only interviews with IT leaders at the ‘IT Lounge’; your chance to ask your burning tech questions and have them answered
- Access to the Computing Delta hub providing market intelligence and research
- Receive our members-only newsletter with exclusive opinion pieces from senior IT Leaders